
Is Saiwai Ward really less educated? Comparing Kawasaki's 7 wards in the census: 48% of 25–64-year-olds hold a university degree, about the city average
Published
Translated from Japanese. If anything differs, the Japanese version is correct.
Key points 30-second read
- We used the 2020 census to check the idea that Kawasaki's northwestern wards are more educated.
- Among 25–64-year-olds, 48.1% in Saiwai are university graduates, close to the city's 49.3%. Nakahara is highest.
- Among 25–34-year-olds, Saiwai (64.7%) is above the city. It looks low overall because it has more older residents.
Image: Kawasaki City
"In Kawasaki, the northwestern wards are more educated, and Saiwai and Kawasaki wards less so." You sometimes hear this. We checked whether it is true using the 2020 national census, which the government carries out every five years. Kawasaki City publishes the tables by ward.
48% of 25–64-year-olds are graduates, about the city average
We compared the share of people whose last school was a university or a graduate school. To avoid differences caused by age, we looked at working-age people aged 25–64.
Saiwai was at 48.1%. That is almost the same as the city as a whole (49.3%) and level with Takatsu (48.2%) and Miyamae (48.9%). The result does not support the idea that Saiwai is low.
Kawasaki Ward, on the other hand, was at 34.0%, lower than the other six wards. Among 25–64-year-olds, it also has the largest share of people whose last school was junior high school or below (7.0%).
64.7% of 25–34-year-olds, above the city average
Looking only at younger people, Saiwai was at 64.7% for ages 25–34. That is slightly above the whole city (64.3%) and higher than Takatsu (63.4%) and Miyamae (61.7%).
8.4% graduate-school graduates, second after Nakahara
Among 25–64-year-olds, 8.4% of Saiwai residents graduated from graduate school. That is second only to Nakahara (9.9%) and higher than Asao (7.9%).
This data alone does not tell us why the share is high in Saiwai.
Nakahara is highest, not the northwest
Among working-age people, the highest was Nakahara (58.1%), home to Musashi-Kosugi. Asao in the northwest was second (55.9%) and Tama third (50.2%). Miyamae was about the same as Saiwai.
"Higher in the northwest" fits Asao. But the highest is Nakahara in the middle of the city, and Miyamae, on the northwestern side, was slightly below the city average.
Saiwai looks low overall because of age
Comparing everyone aged 15 and over, Saiwai is at 39.1%, sixth of the seven wards. The idea that "Saiwai is low" may come from this figure.
The reason is age. In Saiwai, 25.0% of residents aged 15 and over are 65 or older, higher than the whole city (23.1%). And among Saiwai residents aged 65 and over, 16.2% graduated from a university or graduate school. Because more people belong to a generation when fewer went to university, the overall share looks lower.
| Ward | All aged 15+ | Age 25–64 | Age 25–34 | Graduate school (25–64) |
|---|---|---|---|---|
| Nakahara | 51.0% | 58.1% | 73.1% | 9.9% |
| Asao | 50.3% | 55.9% | 66.7% | 7.9% |
| Tama | 44.2% | 50.2% | 65.3% | 6.3% |
| Miyamae | 42.9% | 48.9% | 61.7% | 5.5% |
| Takatsu | 41.3% | 48.2% | 63.4% | 6.4% |
| Saiwai | 39.1% | 48.1% | 64.7% | 8.4% |
| Kawasaki | 28.1% | 34.0% | 51.1% | 4.6% |
| Whole city | 42.5% | 49.3% | 64.3% | 7.1% |
What this data shows and does not show
- What it shows: the share of people living in each ward by the last school they graduated from.
- What it does not show: school test results, the quality of teaching or children's grades. The results of the national academic achievement survey that the city publishes cover the whole city, and we could not find figures by ward.
- The shares exclude people whose last school is unknown ("unknown", about 20% across the city). The share of unknowns differs slightly between wards.
- The figures are as of October 2020 and may differ from today's residents.
When choosing a home or a school, do not rely on these numbers alone; also check the local schools and how easy they are to reach.
Where the numbers come from
We used Table 11 (number of people by last school, by ward) from the "2020 Census: Basic Tabulation on Labour Force Status" published by Kawasaki City. We added up university and graduate-school graduates and divided by the total graduates of elementary school, junior high school, high school, junior college, technical college, university and graduate school (excluding people still in school and unknowns).
Sources
Share
 LINE
 X
 Threads
Links sent on LINE open in your phone’s usual browser (Safari, Chrome, etc.).
Who runs this site

Sky Hand
Runs Roots Lab. / UX writer
Designs UI and UX at a company, and runs and plans Roots Lab. Born in Fukuoka Prefecture.
See profile →You may also like
- Saiwai population at 177,221As of Oct 1, 2026, Saiwai Ward had 177,221 residents in 85,685 households. Compared with the previous month, the population rose by 142 and households by 106.
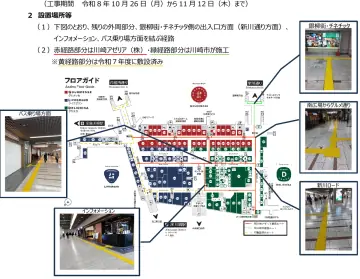 Azalea tactile paving connectedTactile paving was added to the missing sections of the Kawasaki Azalea underground mall.
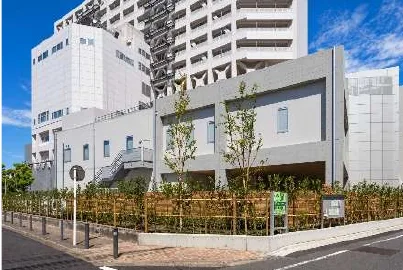 Kawasaki Hospital emergency buildingKawasaki Municipal Hospital's new emergency building opened Nov 9.
- City hall in teal blue from 18thCity hall lit in teal blue, Wed, Nov 18, to Fri, Nov 20.
Comments
Loading…
Sign in with Google to leave a comment.
Comments are published after our team reviews them. We do not publish insults about shops or people, unverifiable accusations, personal information, advertising or repeated posts. We may also remove comments after publishing.
To report a comment or ask us to remove one, contact us on LINE.